
Page 22 - SGG_220316_Teachers_Handbook_Module_3
P. 22
Energy Data Explorer
Research and data to make progress against the world's largest problems. Students may
use interactive maps and graphs to analyze global energy-related indicators such as: Energy
access, Production & Consumption, Energy mix, Electricity mix, Fossil fuels, Renewables, Nuclear,
Transport.
nd
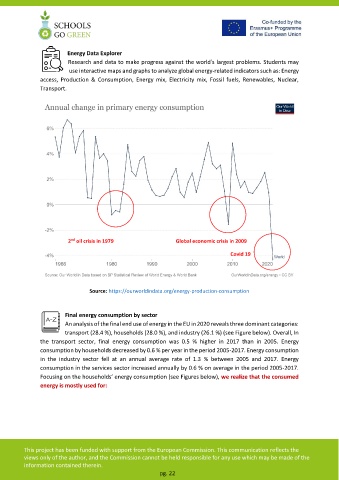
2 oil crisis in 1979 Global economic crisis in 2009
Covid 19
Source: https://ourworldindata.org/energy-production-consumption
Final energy consumption by sector
An analysis of the final end use of energy in the EU in 2020 reveals three dominant categories:
transport (28.4 %), households (28.0 %), and industry (26.1 %) (see Figure below). Overall, In
the transport sector, final energy consumption was 0.5 % higher in 2017 than in 2005. Energy
consumption by households decreased by 0.6 % per year in the period 2005-2017. Energy consumption
in the industry sector fell at an annual average rate of 1.3 % between 2005 and 2017. Energy
consumption in the services sector increased annually by 0.6 % on average in the period 2005-2017.
Focusing on the households’ energy consumption (see Figures below), we realize that the consumed
energy is mostly used for:
This project has been funded with support from the European Commission. This communication reflects the
views only of the author, and the Commission cannot be held responsible for any use which may be made of the
information contained therein.
pg. 22