
Page 20 - SGG_220316_Teachers_Handbook_Module_3
P. 20
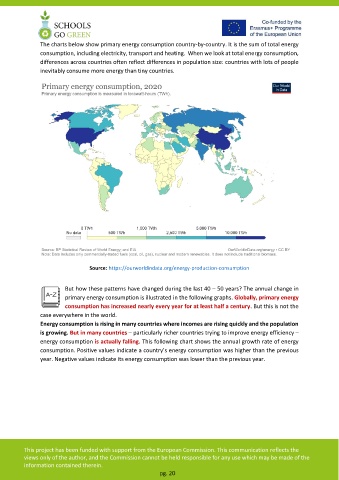
The charts below show primary energy consumption country-by-country. It is the sum of total energy
               consumption, including electricity, transport and heating.  When we look at total energy consumption,
               differences across countries often reflect differences in population size: countries with lots of people
               inevitably consume more energy than tiny countries.


                                Source: https://ourworldindata.org/energy-production-consumption


                        But how these patterns have changed during the last 40 – 50 years? The annual change in
                        primary energy consumption is illustrated in the following graphs. Globally, primary energy
                        consumption has increased nearly every year for at least half a century. But this is not the
               case everywhere in the world.
               Energy consumption is rising in many countries where incomes are rising quickly and the population
               is growing. But in many countries – particularly richer countries trying to improve energy efficiency –
               energy consumption is actually falling. This following chart shows the annual growth rate of energy
               consumption. Positive values indicate a country’s energy consumption was higher than the previous
               year. Negative values indicate its energy consumption was lower than the previous year.


         This project has been funded with support from the European Commission. This communication reflects the
         views only of the author, and the Commission cannot be held responsible for any use which may be made of the

         information contained therein.
                                                         pg. 20