
Page 21 - SGG_220316_Teachers_Handbook_Module_3
P. 21
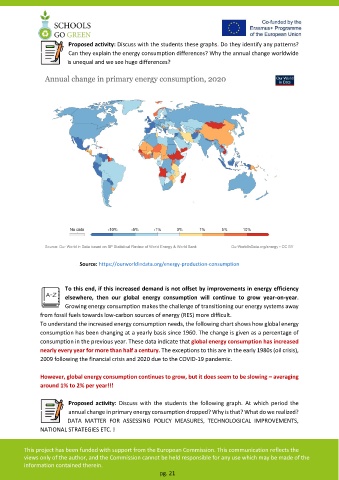
Proposed activity: Discuss with the students these graphs. Do they identify any patterns?
                         Can they explain the energy consumption differences? Why the annual change worldwide
                         is unequal and we see huge differences?


                             Source: https://ourworldindata.org/energy-production-consumption


                        To this end, if this increased demand is not offset by improvements in energy efficiency
                        elsewhere,  then  our  global  energy  consumption  will  continue  to  grow  year-on-year.
                        Growing energy consumption makes the challenge of transitioning our energy systems away
               from fossil fuels towards low-carbon sources of energy (RES) more difficult.
               To understand the increased energy consumption needs, the following chart shows how global energy
               consumption has been changing at a yearly basis since 1960. The change is given as a percentage of
               consumption in the previous year. These data indicate that global energy consumption has increased
               nearly every year for more than half a century. The exceptions to this are in the early 1980s (oil crisis),
               2009 following the financial crisis and 2020 due to the COVID-19 pandemic.

               However, global energy consumption continues to grow, but it does seem to be slowing – averaging
               around 1% to 2% per year!!!

                         Proposed  activity:  Discuss  with  the  students  the  following  graph.  At  which  period  the
                         annual change in primary energy consumption dropped? Why is that? What do we realized?
                         DATA  MATTER  FOR  ASSESSING  POLICY  MEASURES,  TECHNOLOGICAL  IMPROVEMENTS,
               NATIONAL STRATEGIES ETC. !


         This project has been funded with support from the European Commission. This communication reflects the
         views only of the author, and the Commission cannot be held responsible for any use which may be made of the

         information contained therein.
                                                         pg. 21