
Page 10 - SGG_220316_Teachers_Handbook_Module_7
P. 10
Warming Ocean
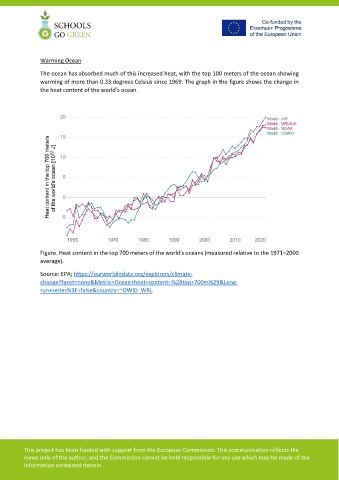
The ocean has absorbed much of this increased heat, with the top 100 meters of the ocean showing
warming of more than 0.33 degrees Celsius since 1969. The graph in the figure shows the change in
the heat content of the world’s ocean.
Figure. Heat content in the top 700 meters of the world's oceans (measured relative to the 1971–2000
average).
Source: EPA; https://ourworldindata.org/explorers/climate-
change?facet=none&Metric=Ocean+heat+content+%28top+700m%29&Long-
run+series%3F=false&country=~OWID_WRL
This project has been funded with support from the European Commission. This communication reflects the
views only of the author, and the Commission cannot be held responsible for any use which may be made of the
information contained therein.